Practical Applications: Building a Causal Model for Clinical Research
I. Introduction – From Statistics to Causal Reasoning
Over the past six lessons in Stats4PT, we’ve built a foundation in statistics not as an isolated discipline of numbers, but as a language for describing uncertainty, learning from experience, and drawing conclusions with caution. We’ve explored how statistics operates in open systems like clinical practice where variability, context, and complexity are the rule, not the exception.
We’ve emphasized that statistical inference is inductive. It generalizes from observations to claims about the world. But now we take a necessary next step: moving from inference to explanation. That’s where causal reasoning begins.
Causal reasoning asks: What leads to what? What happens if we intervene? Why do some patients recover and others don’t, even when they look “statistically” similar?
This is where causal models help. They are structured, visual representations of our beliefs about how variables are causally connected. Unlike statistical summaries, which focus on describing what we’ve observed, causal models do both: they represent what we’ve observed and what we believe is happening beneath the surface. They map not just associations, but assumptions—connections we infer from experience, research, and theory about how one thing leads to another. These assumptions may involve unmeasured mechanisms, background structures, or contextual factors that shape what we see but remain invisible in observable data (i.e. the empirical domain).
And here’s the key insight:
Every arrow in a causal model represents a causal assumption.
That assumption might be grounded in:
Your clinical experience (inductive learning from cases),
Published research (inductive learning from systematic observation and statistical inference),
Mechanistic understanding or theoretical reasoning.
In each case, the arrow encodes a belief: Variable A influences Variable B in some way that matters. Whether or not we’re conscious of it, we all carry these causal maps in our heads. The value of tools like Directed Acyclic Graphs (DAGs) is that they force us to draw the map explicitly.
This lesson is where we make those maps real—on paper, in code, and in practice.
We’ll use DAGitty, a web-based tool, to sketch our assumptions and analyze what they imply. We’ll also work with Models4PT GPT, an assistant designed to help extract and structure causal knowledge in clinical research and reasoning.
But this isn’t just about drawing arrows. It’s about stepping into epistemic responsibility. Because once we start modeling causality, we’re not just describing what is: we’re saying something about what matters, what changes what, and what could go wrong if we get it wrong.
II. What Is a Causal Model?
A causal model is a structured way to express our beliefs about how different variables influence one another. Most often, we use Directed Acyclic Graphs (DAGs) to represent these models. In a DAG, each arrow represents a causal assumption—not just a correlation or observed pattern, but a directional claim: this affects that.
These models are powerful because they do two things at once:
Describe observed relationships (what we can measure),
Express unobserved mechanisms or structures (what we infer or theorize).
They help us clarify thinking, detect bias, determine which variables to adjust for in analysis, and make our reasoning transparent. Importantly, a causal model isn’t generated automatically from data—it’s built from what we assume, believe, or know, and is always open to challenge and refinement.
III. Building a Causal Model Step-by-Step
The process of building a causal model is less about drawing lines and more about clarifying thought. Each arrow forces a decision: Do I believe there’s a causal connection here? Why?
Here’s a simple workflow to begin:
Start with a question.
Choose a clinical or research question. For example:
What influences return to work after low back pain?
List (or extract) relevant variables.
Think about exposures, outcomes, potential mediators, confounders, and structural influences. Don’t worry yet about what you can measure—include what you believe matters. If you’re starting with a research paper you can start by extracting the variables it includes (as we do below in an example).
Sketch the model.
Using pen and paper, or DAGitty, begin placing arrows. Ask:
Is there reason to believe A causes B?
Is this supported by research, experience, or theory?
Could a third variable explain both?
Label what’s empirical vs. theoretical.
Note which nodes are based on observed data (empirical), inferred mechanisms (actual), or deeper structures (real). This adds clarity to what you’re claiming and where uncertainty lives.
Check for structure.
Are there backdoor paths between exposure and outcome?
Are there colliders you might mistakenly condition on?
Are mediators appropriately placed?
Pause to reflect.
Ask yourself: Would someone else agree with these arrows? What would they challenge? What am I assuming without noticing?
This process isn’t about perfection—it’s about transparency. A causal model is not a final answer. It’s a structured starting point for deeper reasoning and better questions.
IV. Models4PT GPT – A Clinical Causal Modeling Assistant
To support the modeling process, we’ve developed Models4PT GPT—a causal modeling assistant tailored for clinical reasoning and research.
It helps with:
Extracting exposures, outcomes, confounders, and mediators from clinical questions or texts.
Generating DAGitty-compatible code, so you can visualize your model instantly.
Identifying bias and confounding, using backdoor and frontdoor logic.
Classifying variables into Bhaskar’s empirical, actual, and real domains—adding ontological clarity to your model.
You can start with a simple sentence:
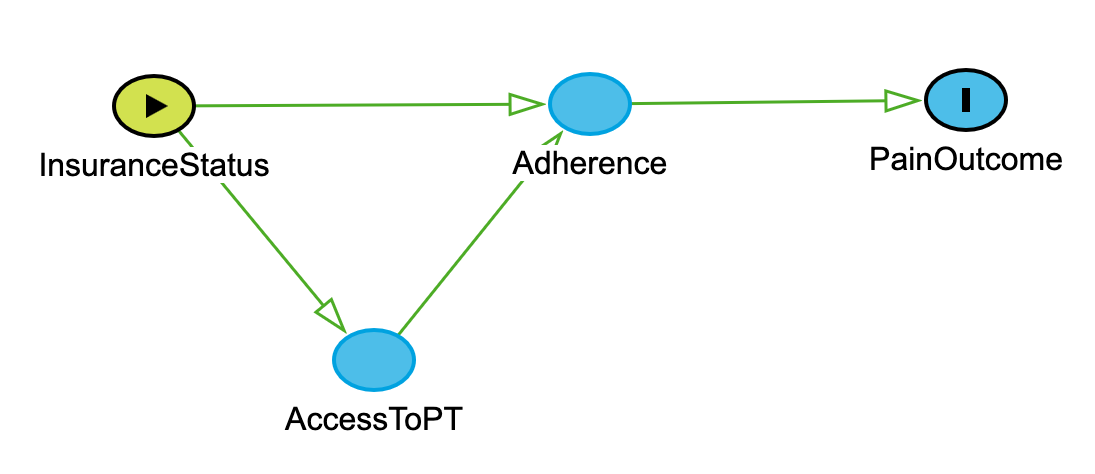
“Model how insurance status influences access to PT, adherence, and pain outcomes.”
Models4PT responds with:
dag {
InsuranceStatus -> AccessToPT -> Adherence -> PainOutcome
InsuranceStatus -> Adherence
}
When entered into DAGitty produces:
Use DAGitty to further consider assumptions, build drafts, and learn by doing. It won’t replace your judgment—but it will help make your thinking visible.
IV.B. Worked Example – Modeling Dry Needling Research
To bring this lesson into focus, I applied Models4PT GPT to a systematic review and meta-analysis by Sánchez-Infante et al. (2021) on dry needling (DN) for neck pain. This example demonstrates how we can move from simple outcome mapping to complex, theory-informed causal modeling.
Each version of the model reflects an increasing depth of reasoning—starting with empirical observations, integrating confounders and effect modifiers, and ending with unmeasured mechanisms from Bhaskar’s actual or real domain.
The pdf is uploaded to Models4PT GPT and it’s asked for a basic exposure - outcome DAG to generate a causal model that is consistent with the statistical model used to test the hypotheses that this systematic review investigates.
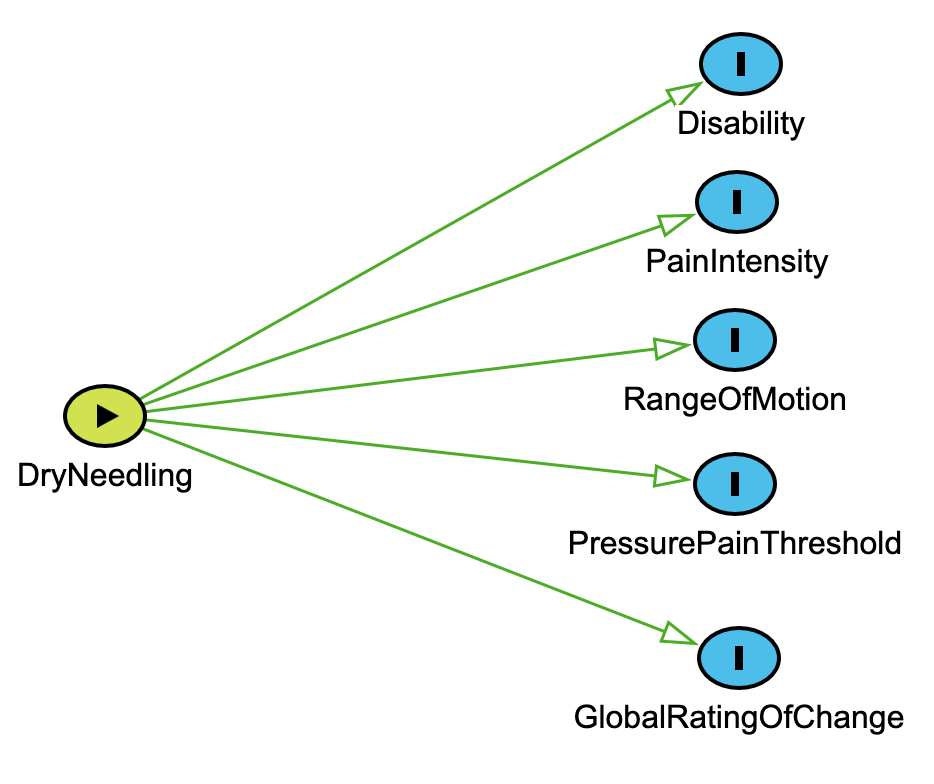
1. Basic Exposure–Outcome DAG
Draws on Section III: Building a Causal Model Step-by-Step
We begin by identifying the exposure (DryNeedling) and several measured outcomes reported in the meta-analysis (e.g., PainIntensity, Disability). This reflects the initial stage of model building where we ask: What was measured, and what’s the assumed causal effect?
dag { DryNeedling [exposure]

  PainIntensity [outcome]

  Disability [outcome]

  PressurePainThreshold [outcome]

  RangeOfMotion [outcome]

  GlobalRatingOfChange [outcome]

  DryNeedling -> PainIntensity

  DryNeedling -> Disability

  DryNeedling -> PressurePainThreshold

  DryNeedling -> RangeOfMotion

  DryNeedling -> GlobalRatingOfChange

}
Key connection to earlier material: Each arrow represents a causal assumption grounded in the authors’ interpretations of the evidence—this is exactly the kind of structure we discussed in Section I: From Statistics to Causal Reasoning. This model is a statistical model—those based only on empirical regularities. A statistical model describes what we’ve observed, typically without addressing why or how those relationships exist.
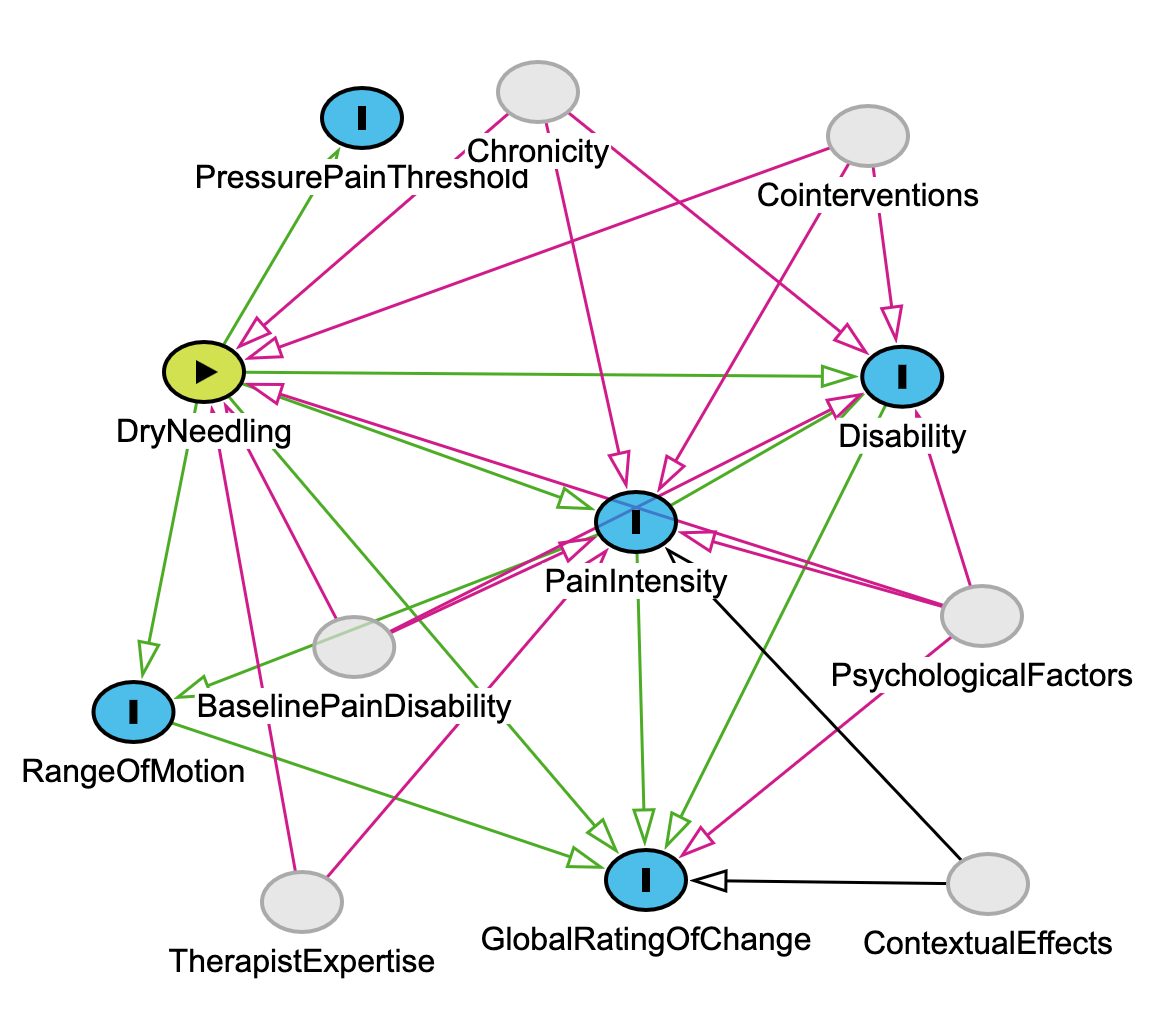
2. Intermediate DAG with Confounders and Effect Modifiers
Extends Section II: What Is a Causal Model?
We now add unobserved but clinically relevant variables (e.g., PsychologicalFactors, Chronicity, Cointerventions) that plausibly influence both the intervention and its outcomes. This layer reflects real-world complexity—not all effects are cleanly measured, and not all variation is random. This is accomplished by asking Models4PT to provide it. Note - for this example I have not made any adjustments just to show what Models4PT came up with, however I do believe modifications are necessary.
dag {
// Exposure and outcomes from above included with this comment excluded

PsychologicalFactors -> PainIntensity
PsychologicalFactors -> Disability
PsychologicalFactors -> GlobalRatingOfChange
PsychologicalFactors -> DryNeedling
Chronicity -> PainIntensity
Chronicity -> Disability
Chronicity -> DryNeedling
BaselinePainDisability -> PainIntensity
BaselinePainDisability -> Disability
BaselinePainDisability -> DryNeedling
TherapistExpertise -> DryNeedling
TherapistExpertise -> PainIntensity
}
Connection to earlier concepts: This reflects inductive learning from clinical experience and literature (as we emphasized in Section III), where we integrate prior knowledge into model structure—even when those variables are unmeasured.
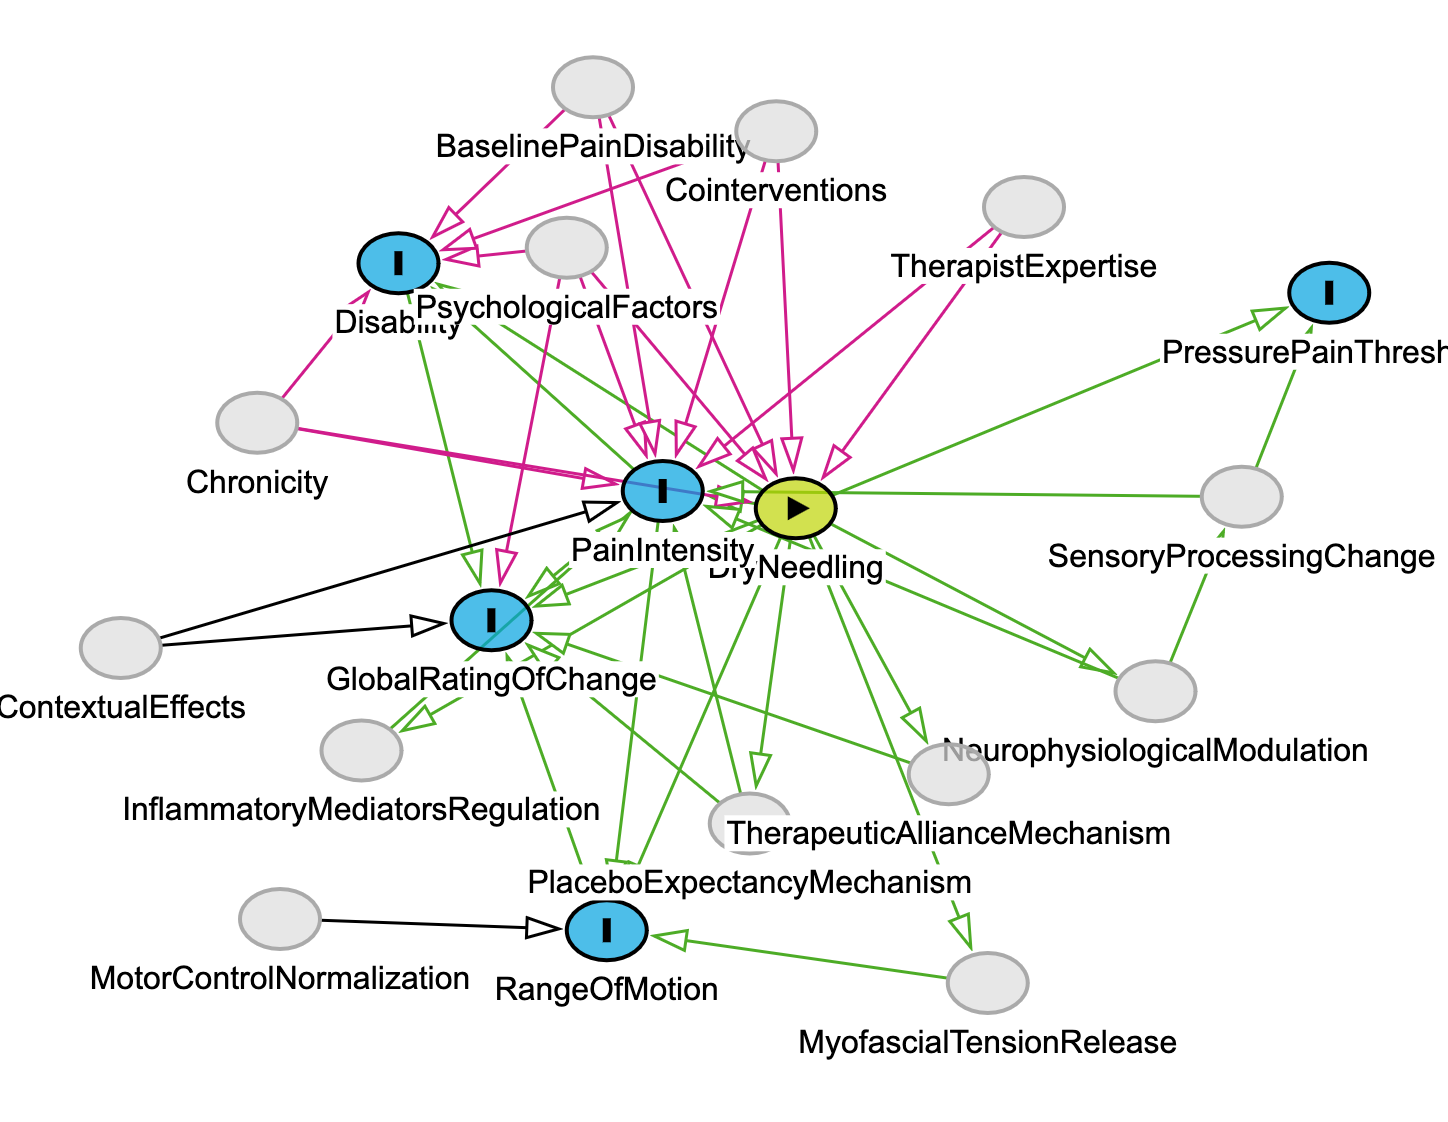
3. Critical Realist DAG with Ontological Depth
Directly builds on Bhaskar’s domains
This final version introduces underlying causal mechanisms that are not directly measured in the Sánchez-Infante study but are essential for explanation—such as NeurophysiologicalModulation and PlaceboExpectancyMechanism. And again, it’s based on asking Models4PT GPT to provide that next level of analysis based on the introduction and discussion of the paper and any other information the user provides. I did not, but could have, added additional papers to deepen the actual and real domain analysis.
dag {
  // Nodes and arrows from earlier versions...

  DryNeedling -> NeurophysiologicalModulation
  DryNeedling -> InflammatoryMediatorsRegulation
  DryNeedling -> MyofascialTensionRelease
  DryNeedling -> PlaceboExpectancyMechanism
  DryNeedling -> TherapeuticAllianceMechanism

  NeurophysiologicalModulation -> PainIntensity
  PlaceboExpectancyMechanism -> GlobalRatingOfChange
  TherapeuticAllianceMechanism -> GlobalRatingOfChange
}Relevance: This is the domain of the actual and real—as described in Section II. These mechanisms are not statistical artifacts; they are causal powers we theorize based on physiology, neuroscience, and therapeutic interaction. They help us explain why the arrows in the earlier models might exist at all.
Critical Reflection – When to Override the Model (Meehl, 1973)
In Lesson 6, we explored Paul Meehl’s famous caution to clinicians:
“Only override the model if you have causal knowledge the model doesn’t.”
—Paul Meehl, 1973
Here, Meehl was talking about statistical models—those based only on empirical regularities. These models describe what we’ve observed, typically without addressing why or how those relationships exist.
In this lesson, we’ve expanded beyond that. The basic DAG—linking DryNeedling to outcomes like Pain Intensity or Disability—is structurally similar to a statistical model. It shows us what was measured and assumed based on group-level data.
But the critical realist DAG we’ve built includes:
Confounders and effect modifiers informed by clinical knowledge (e.g., PsychologicalFactors, TherapistExpertise), that can (and should) be controlled or adjusted for in the statistical analysis; and
Unmeasured mechanisms from Bhaskar’s real domain (e.g., NeurophysiologicalModulation, TherapeuticAllianceMechanism).
These additions represent causal knowledge the statistical model doesn’t have. They’re not overrides—they’re extensions. This is what Meehl would have meant by justified deviation from a purely statistical model: adding inferences based on theory, experience, and mechanistic insight.
In this context we’re not violating Meehl’s warning, we’re fulfilling it. We’re acknowledging that to act responsibly as clinicians and researchers, we must often go beyond the data. But we must do so explicitly and transparently, with our assumptions made visible, as we’ve done in each version of the DAG above.
V. Reflective Wrap-Up
Causal modeling isn’t just a tool for data analysis—it’s a method for clarifying thought. When we draw a DAG, we’re not just summarizing evidence; we’re making our reasoning visible.
Each arrow is a decision: Do I believe this causes that?
Each node reflects a judgment: Does this variable matter? Should it be observed, inferred, or theorized?—and when applying the model to a particular person, these judgments invite further questions: Is this factor present here? Is it measurable in this case? Does it operate differently given this patient’s context?
In this way, every DAG is a draft of our beliefs. It can be critiqued, improved, challenged—but only because we’ve put those beliefs into a structure others can see.
What we’ve modeled here—through DAGitty, through Models4PT GPT, and through reflection—is a clinical inquiry process that extends from empirical evidence to real causal structures. These models do more than describe what we’ve seen—they help us think better about what’s going on and what we might do about it.
For space, we haven’t walked through every modeling step from Section III in full detail with the dry needling example. But those steps—identifying variables, labeling domains, checking for backdoor paths and colliders—remain essential. I encourage you to apply them to the example models here or, better yet, to a clinical question of your own. Use DAGitty and Models4PT to test, revise, and learn through the process.


